Visualise your data
An overview of your most valuable data
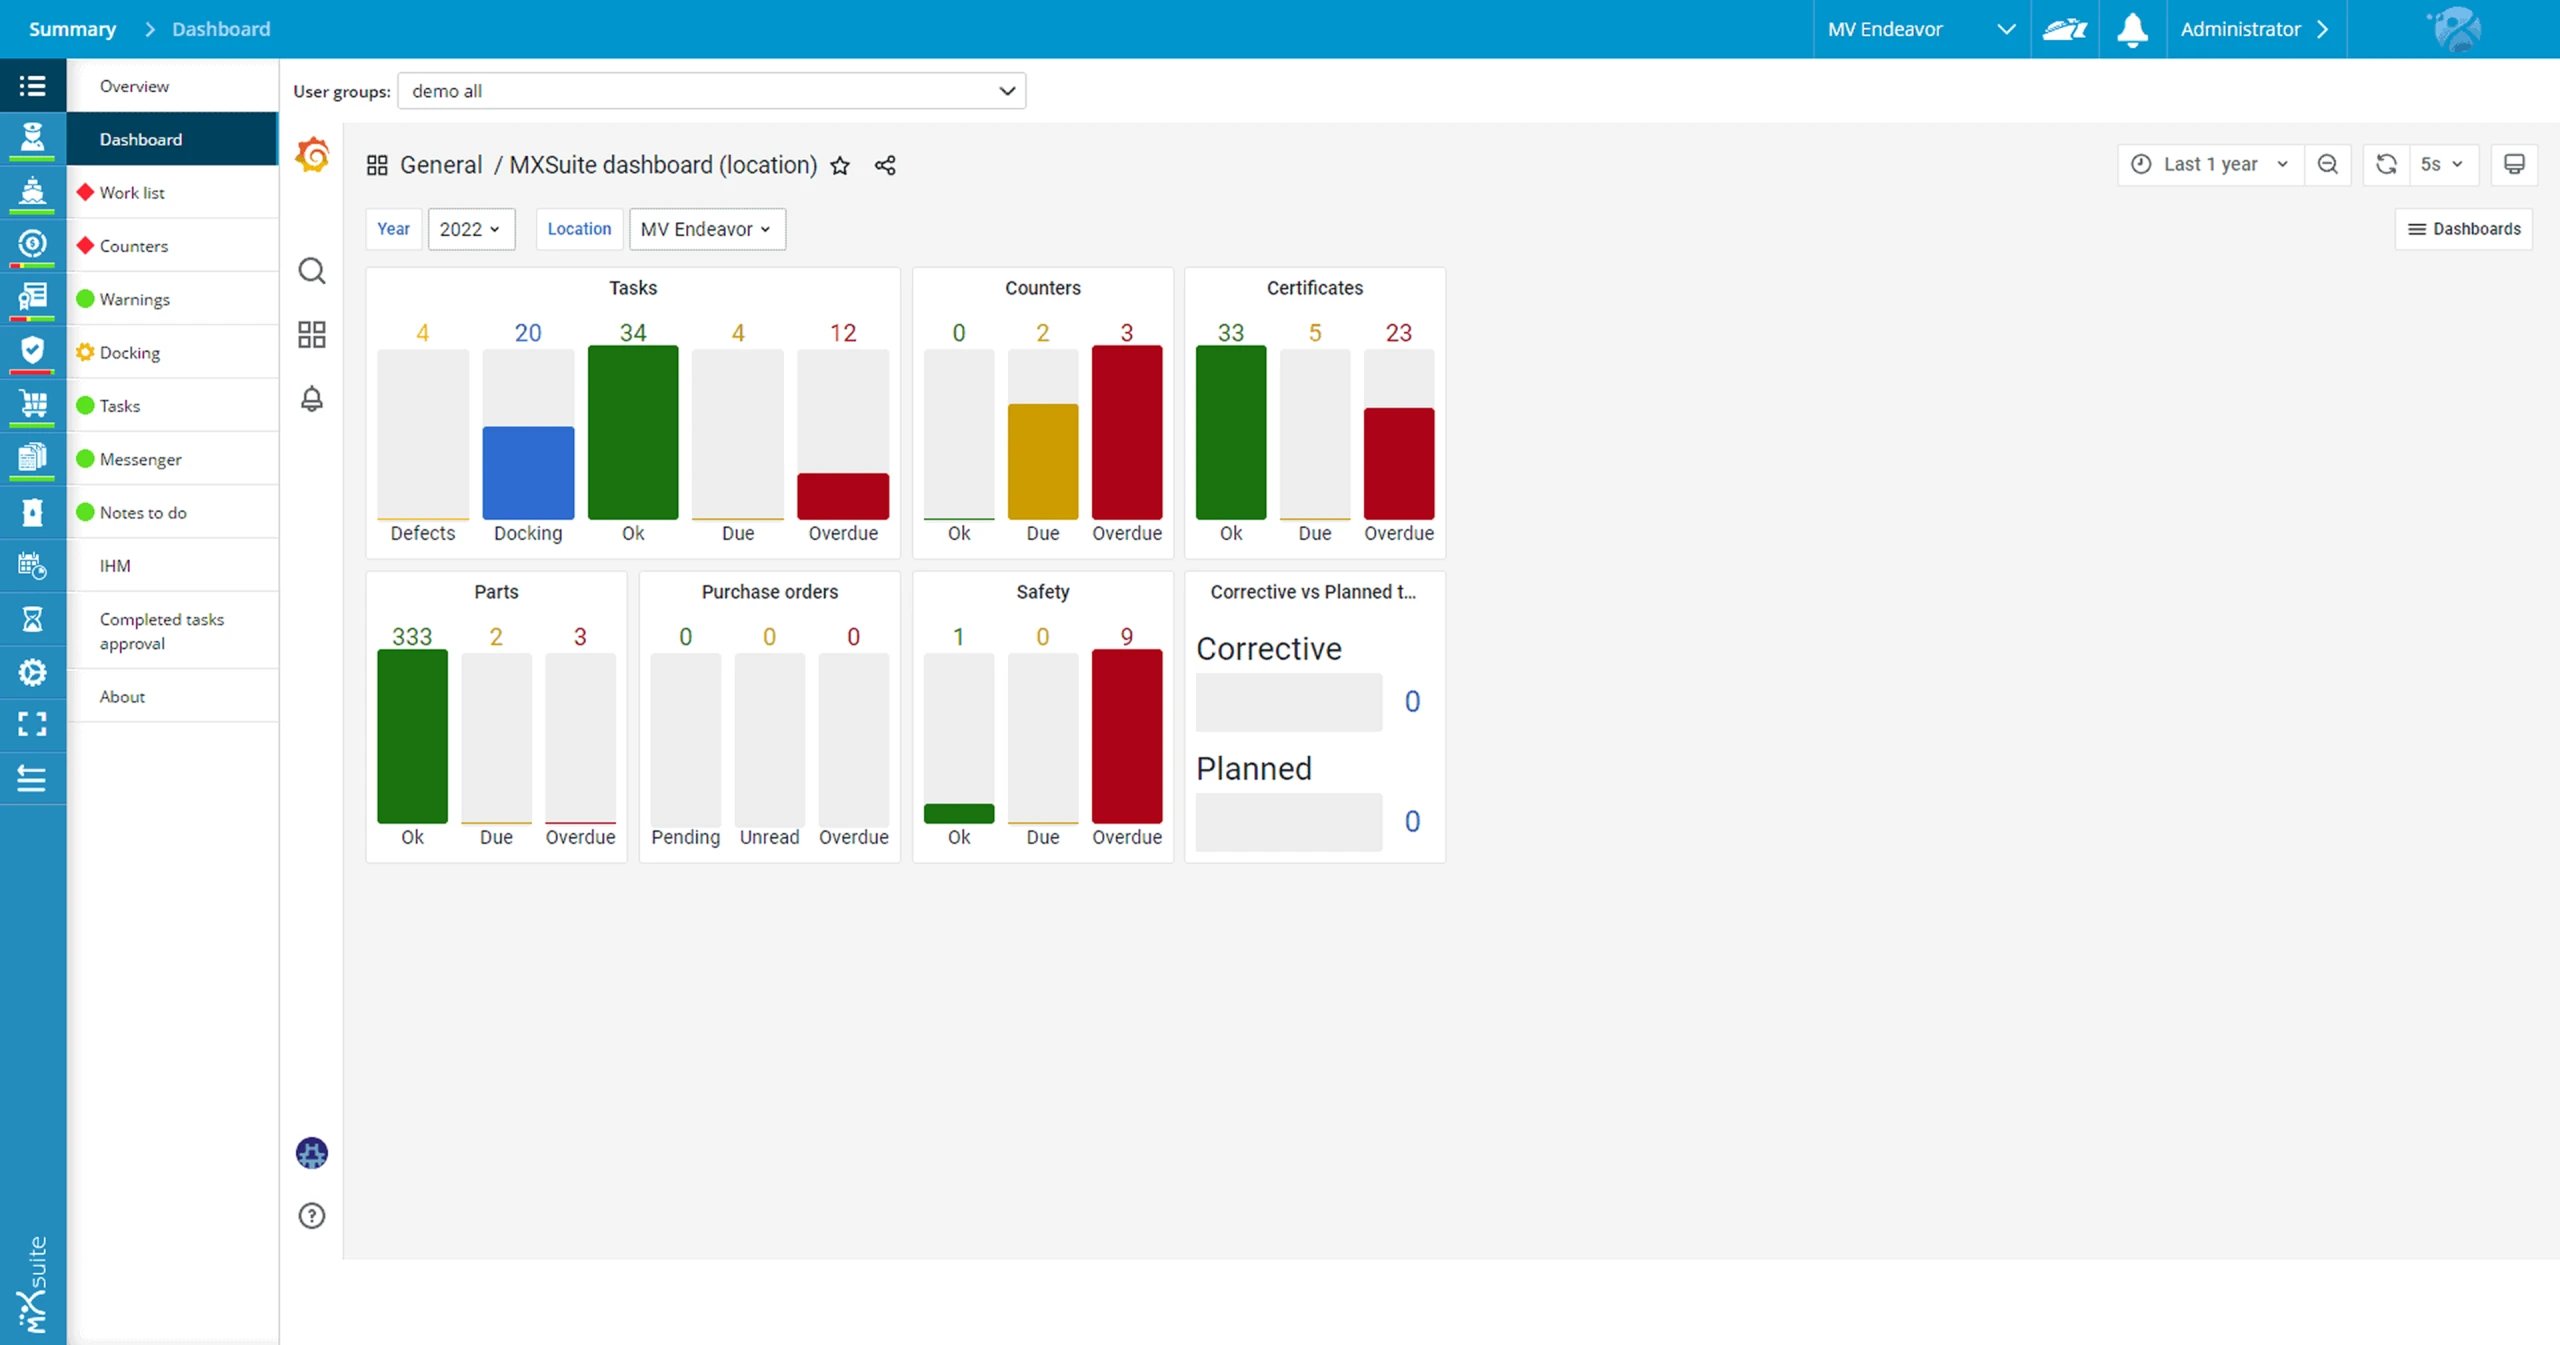
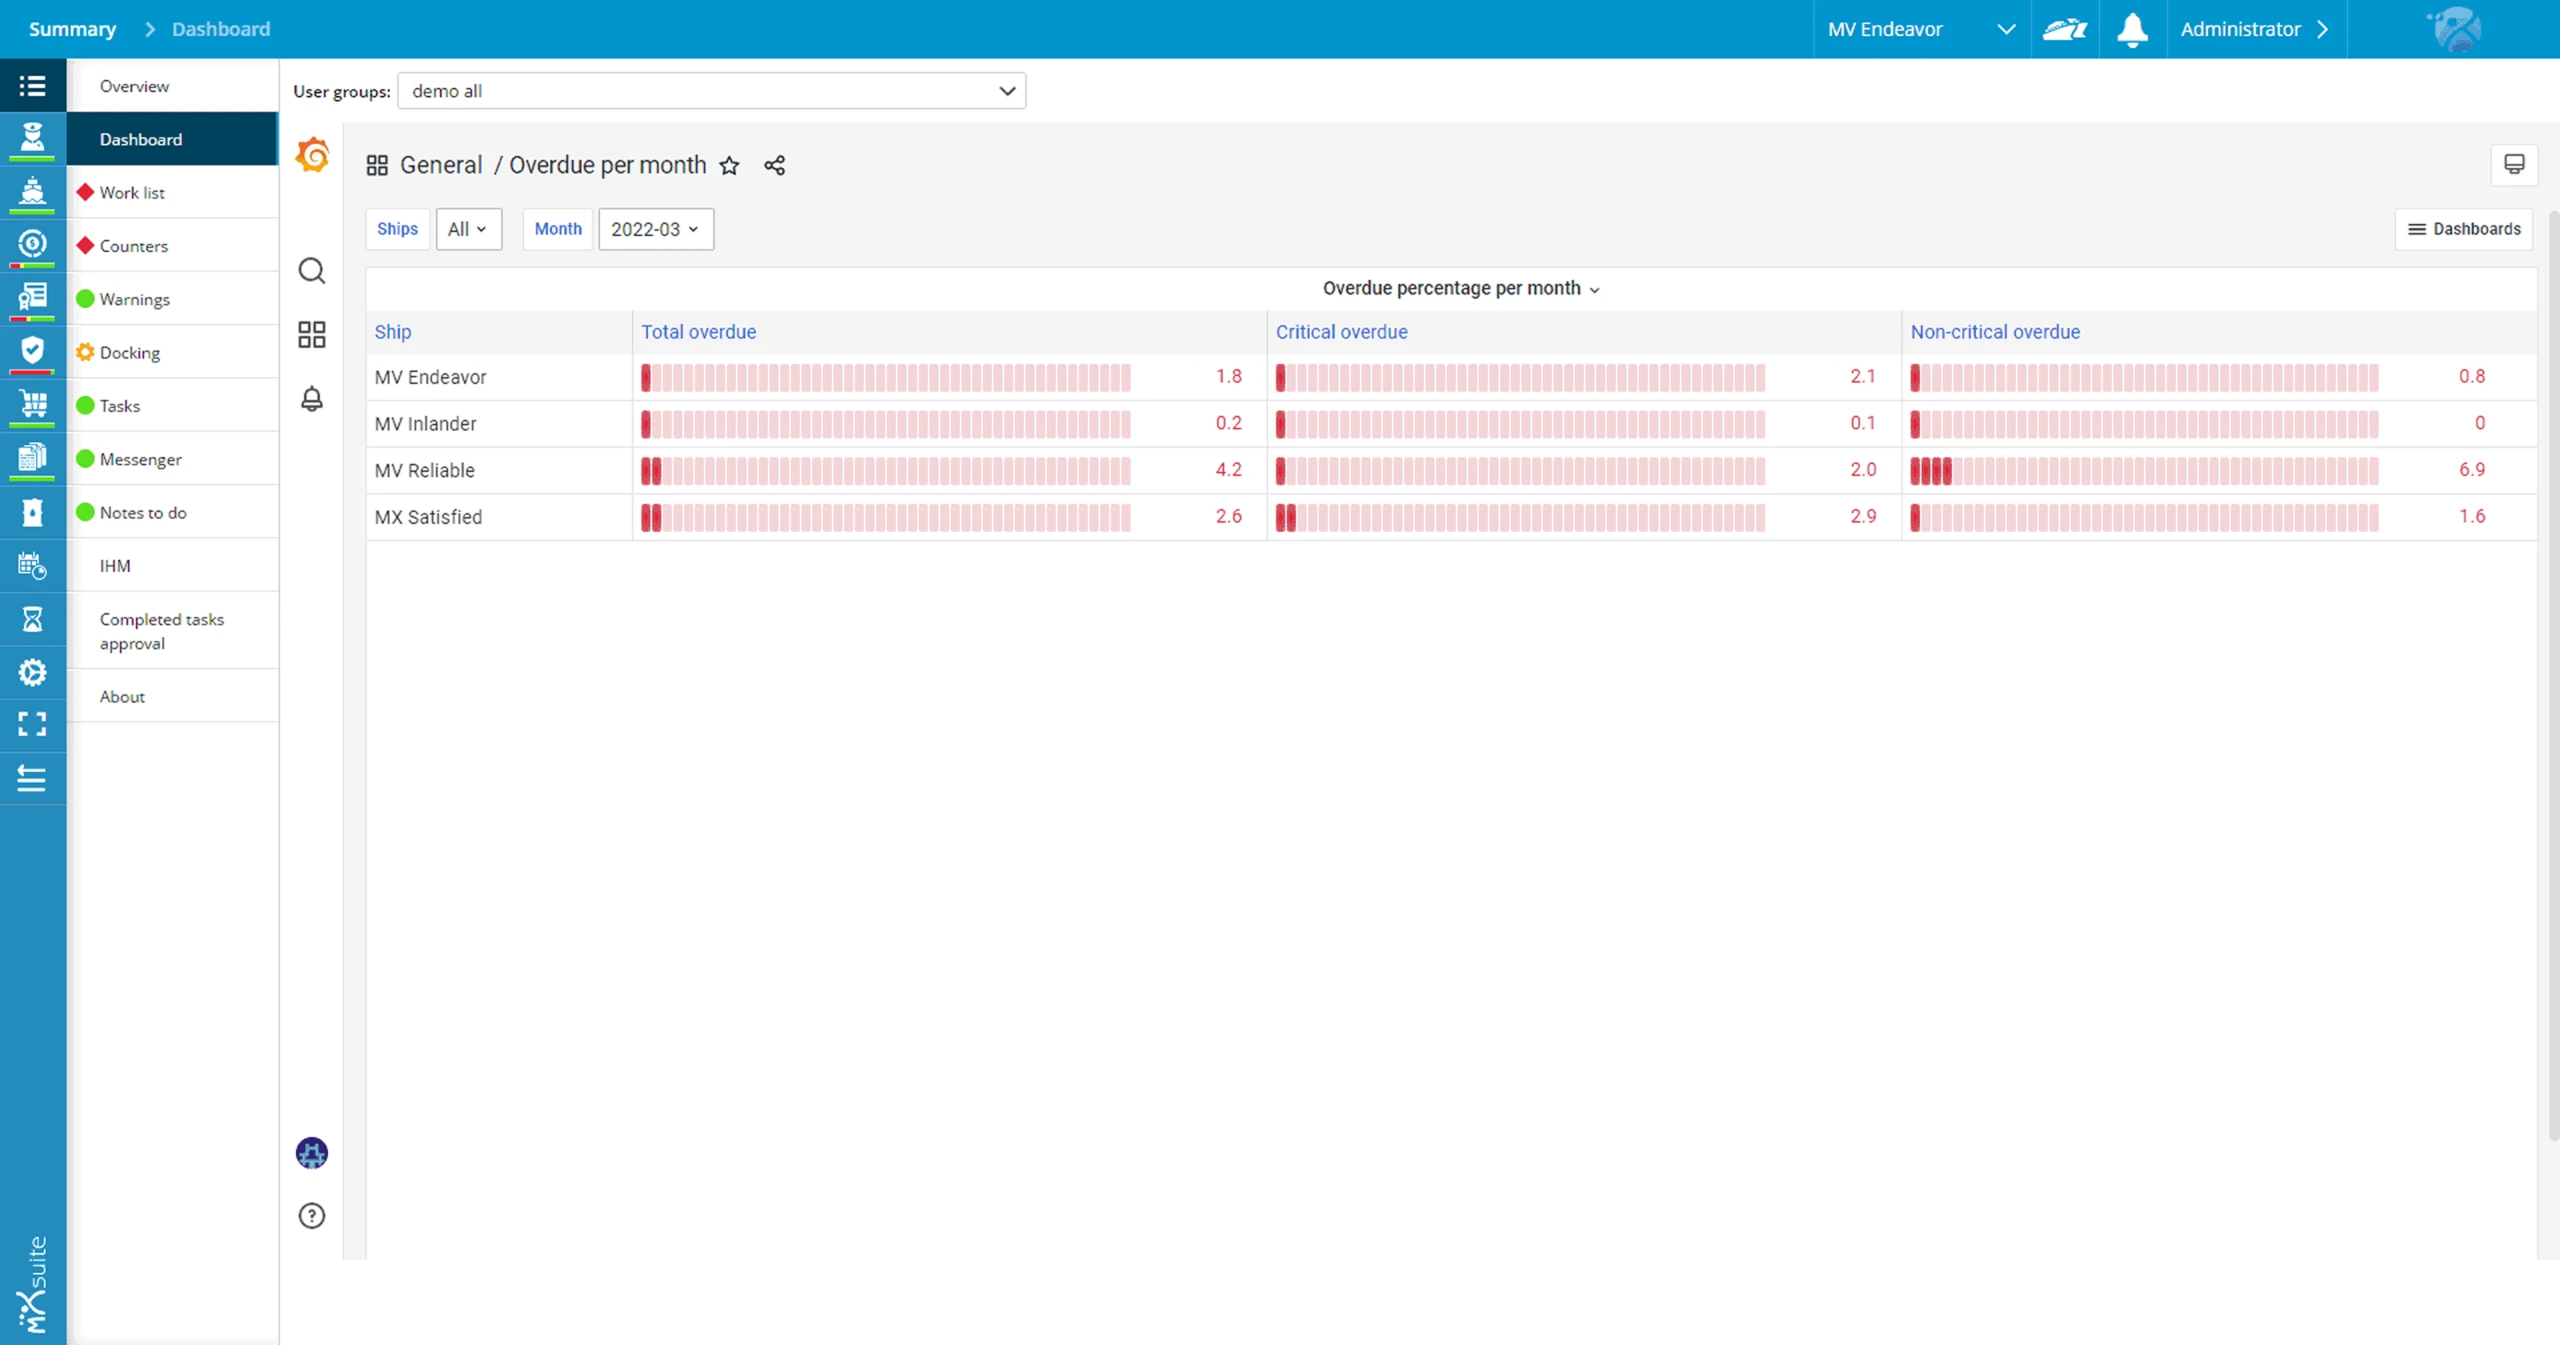
The dashboard allows you to visualise any data from the MXSuite database in the way and timeframe you prefer. Visualisations can be displayed as graphs, gauges, bars, tables or pie charts. You can set the date and time ranges of your selected data entirely to your needs.


Data insights for strategic fleet management
MXSuite collects valuable data, but what do you do with it? Our MXSuite dashboards automatically visualise data that can help optimise your business operations.
The answers to important questions such as the status of your budget, the number of purchase requisitions, or the ratio between planned and corrective maintenance are visualised in one clear overview. The result is information you can use to further optimise your fleet.
Want to learn more about the dashboard setup?
More services
Cloud service
Install MXSuite on your own office server or let us host it for you. We take care of updates, backups and maintain 99% uptime.
Training
Get the most out of MXSuite with our tailor-made training programme on location, or explore the possibilities online in our learning centre.
Support
We are here for you. Log in to our service portal to contact our specialists or request remote support.
