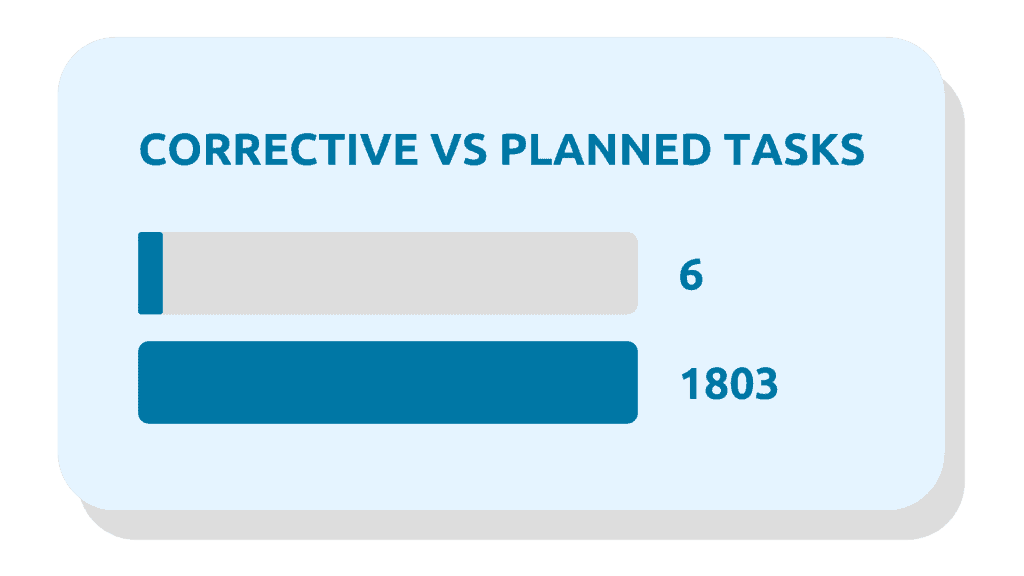
What is the ratio between planned maintenance and corrective maintenance?
What is the status of my budget?
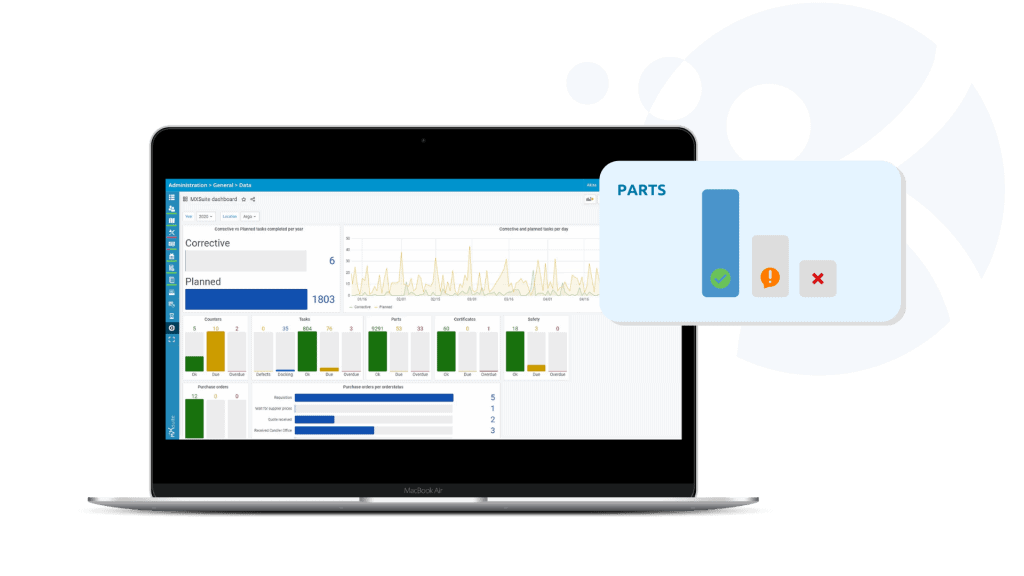
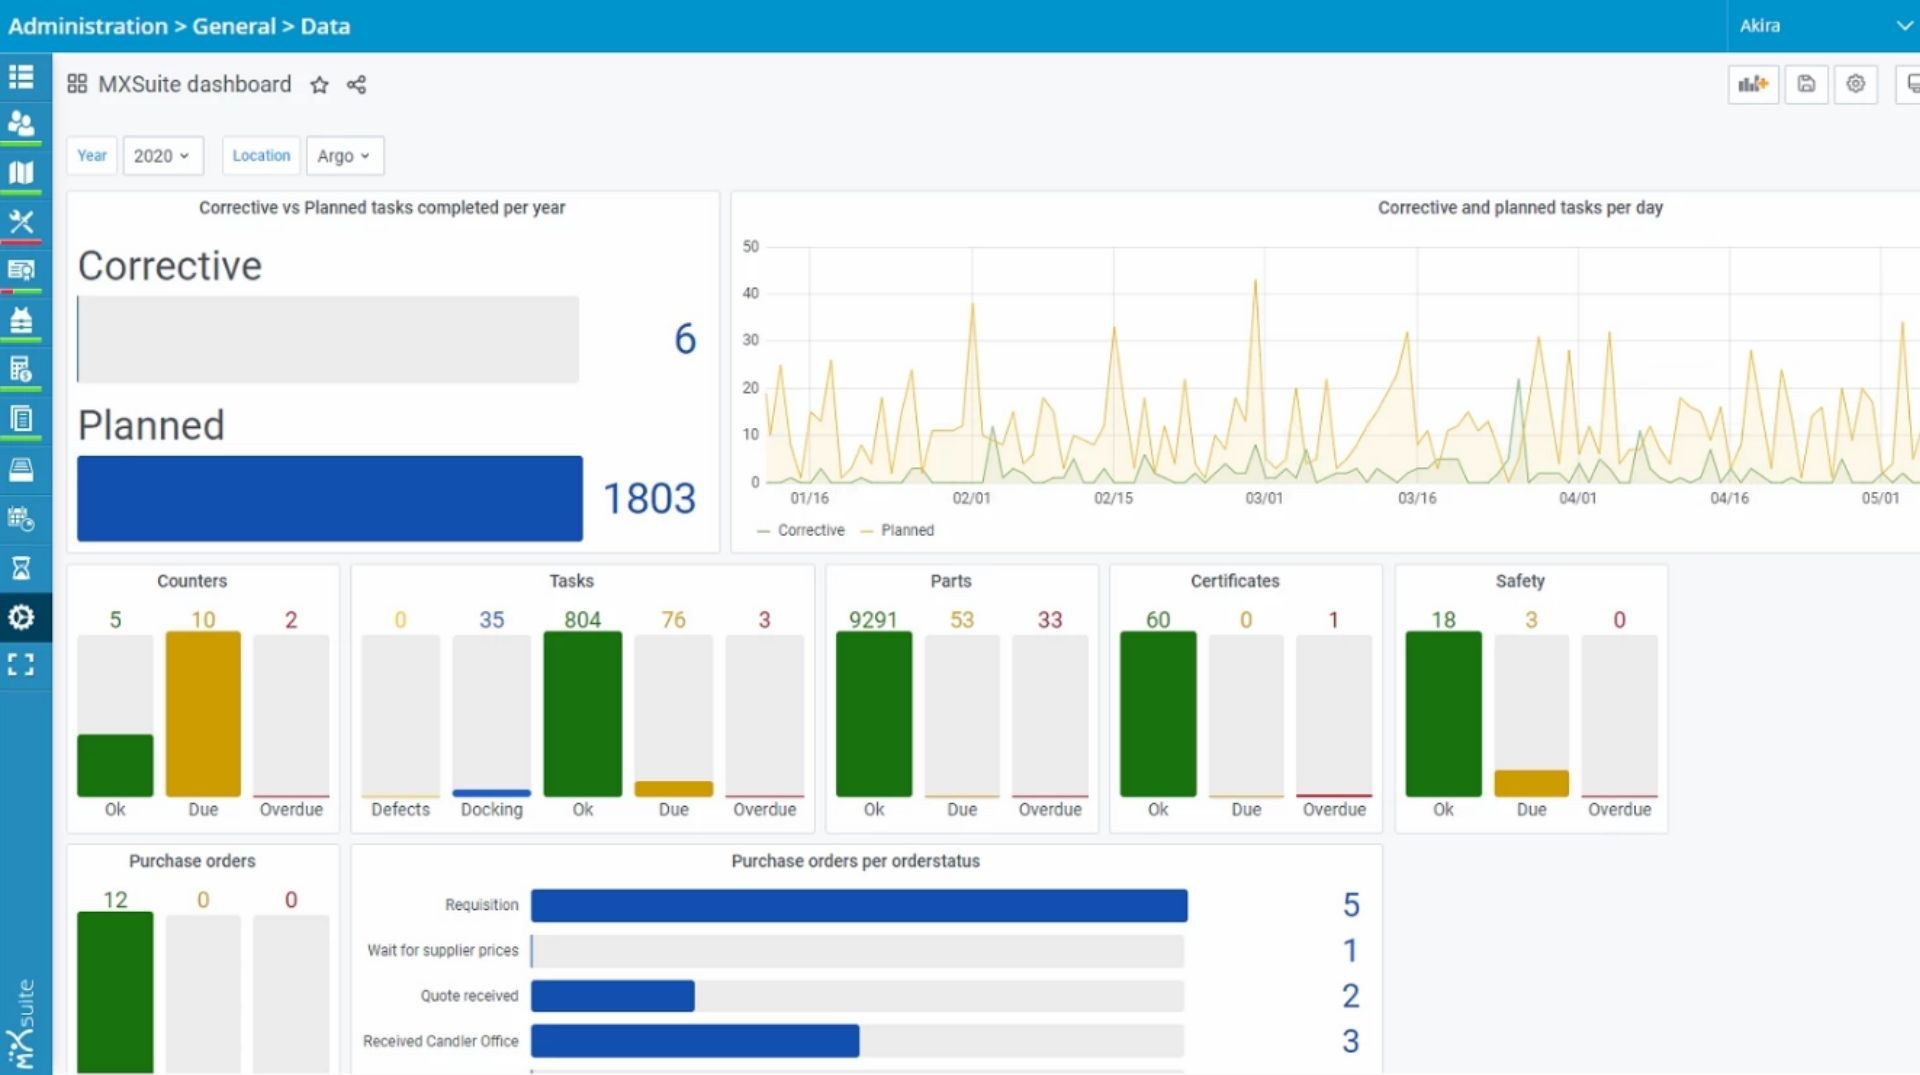
Dashboard
data insights for strategic fleet management
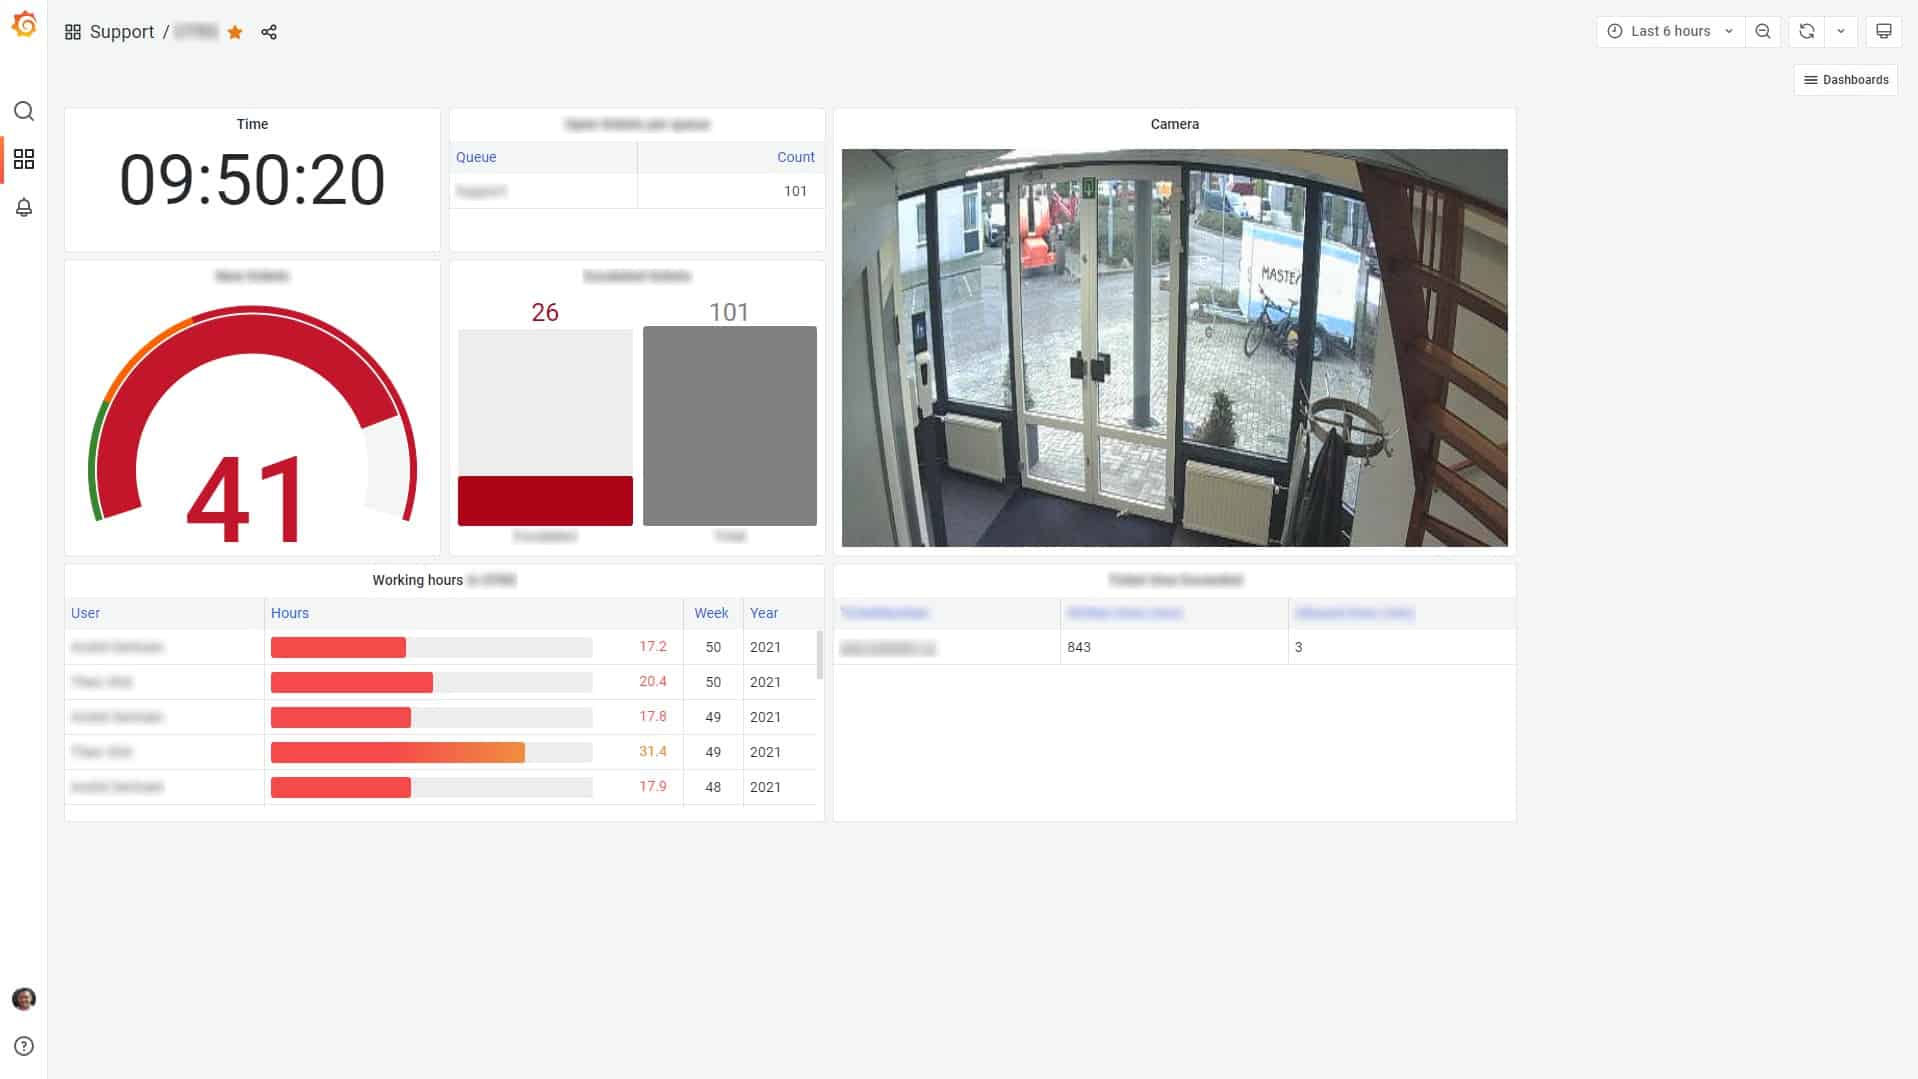
MXSuite collects valuable data, but what do you do with it? Our MXSuite dashboards automatically visualises data that can be used to help optimize your business operations. The answer to important questions such as the status of your budget, the amount of purchase requisitions or the ratio between planned and corrective maintenance, are visualized in one clear overview. The results which you can use to further optimise your fleet.
Gain strategic insights from all data of your fleet
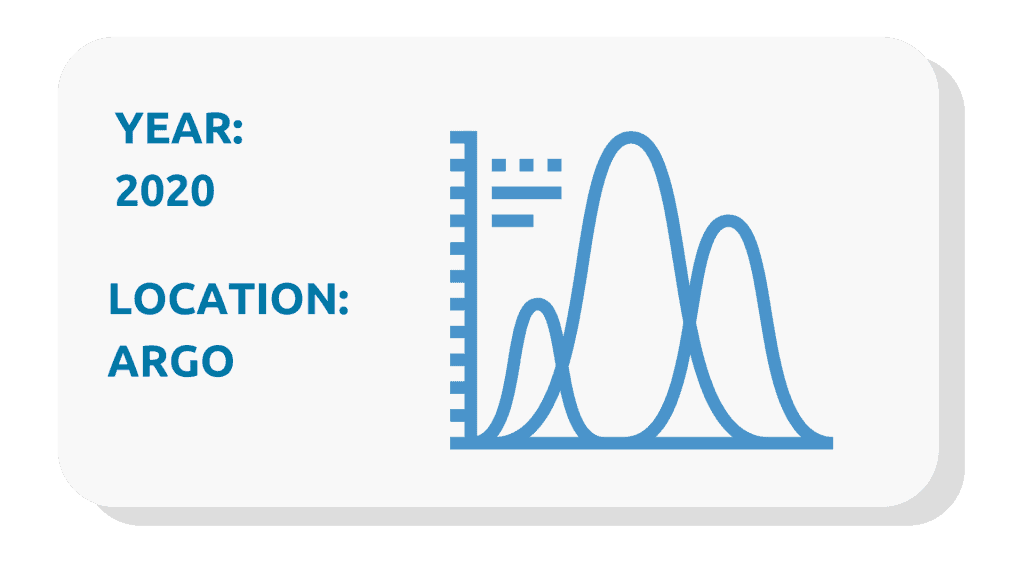
Adjust the dashboard to your needs: visualisations, timeframe, selected data
Realtime insight in your fleet in one clear overview
visualise your data
data driven decisions were never this easy
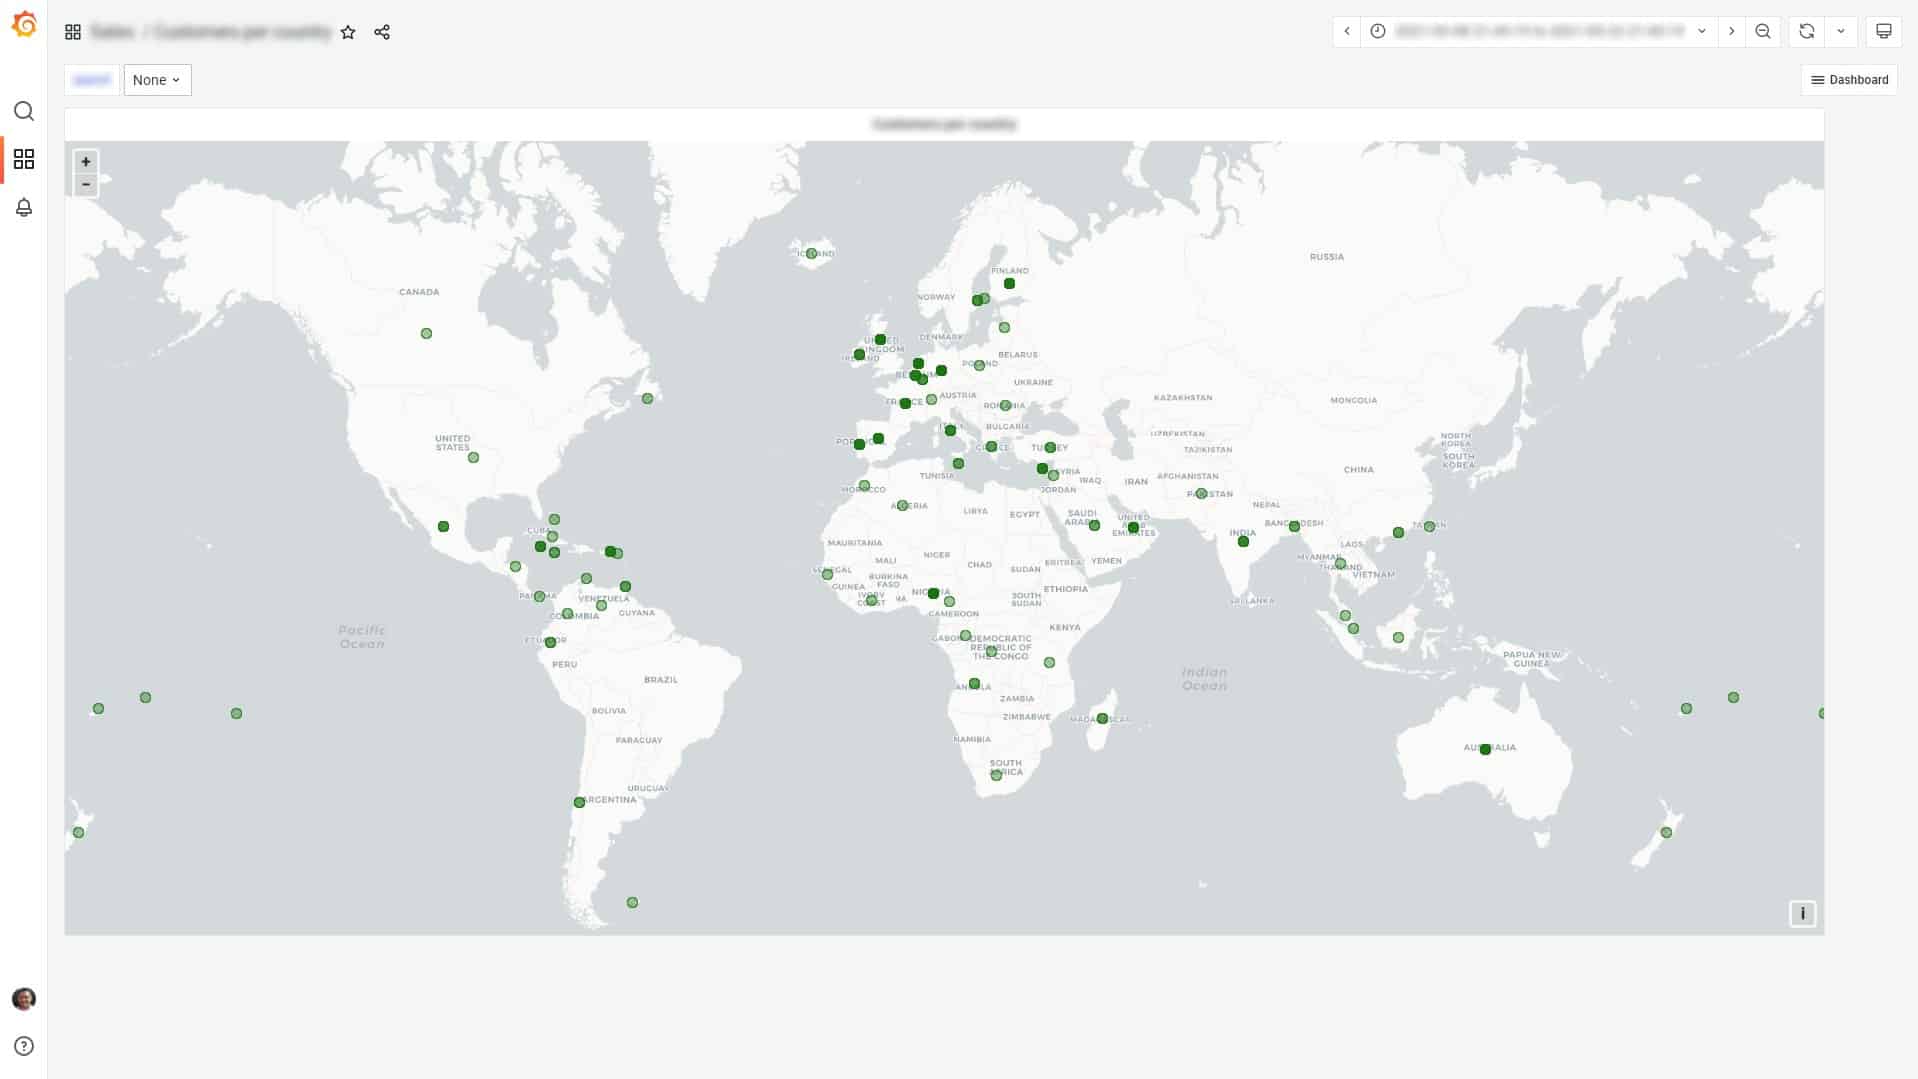
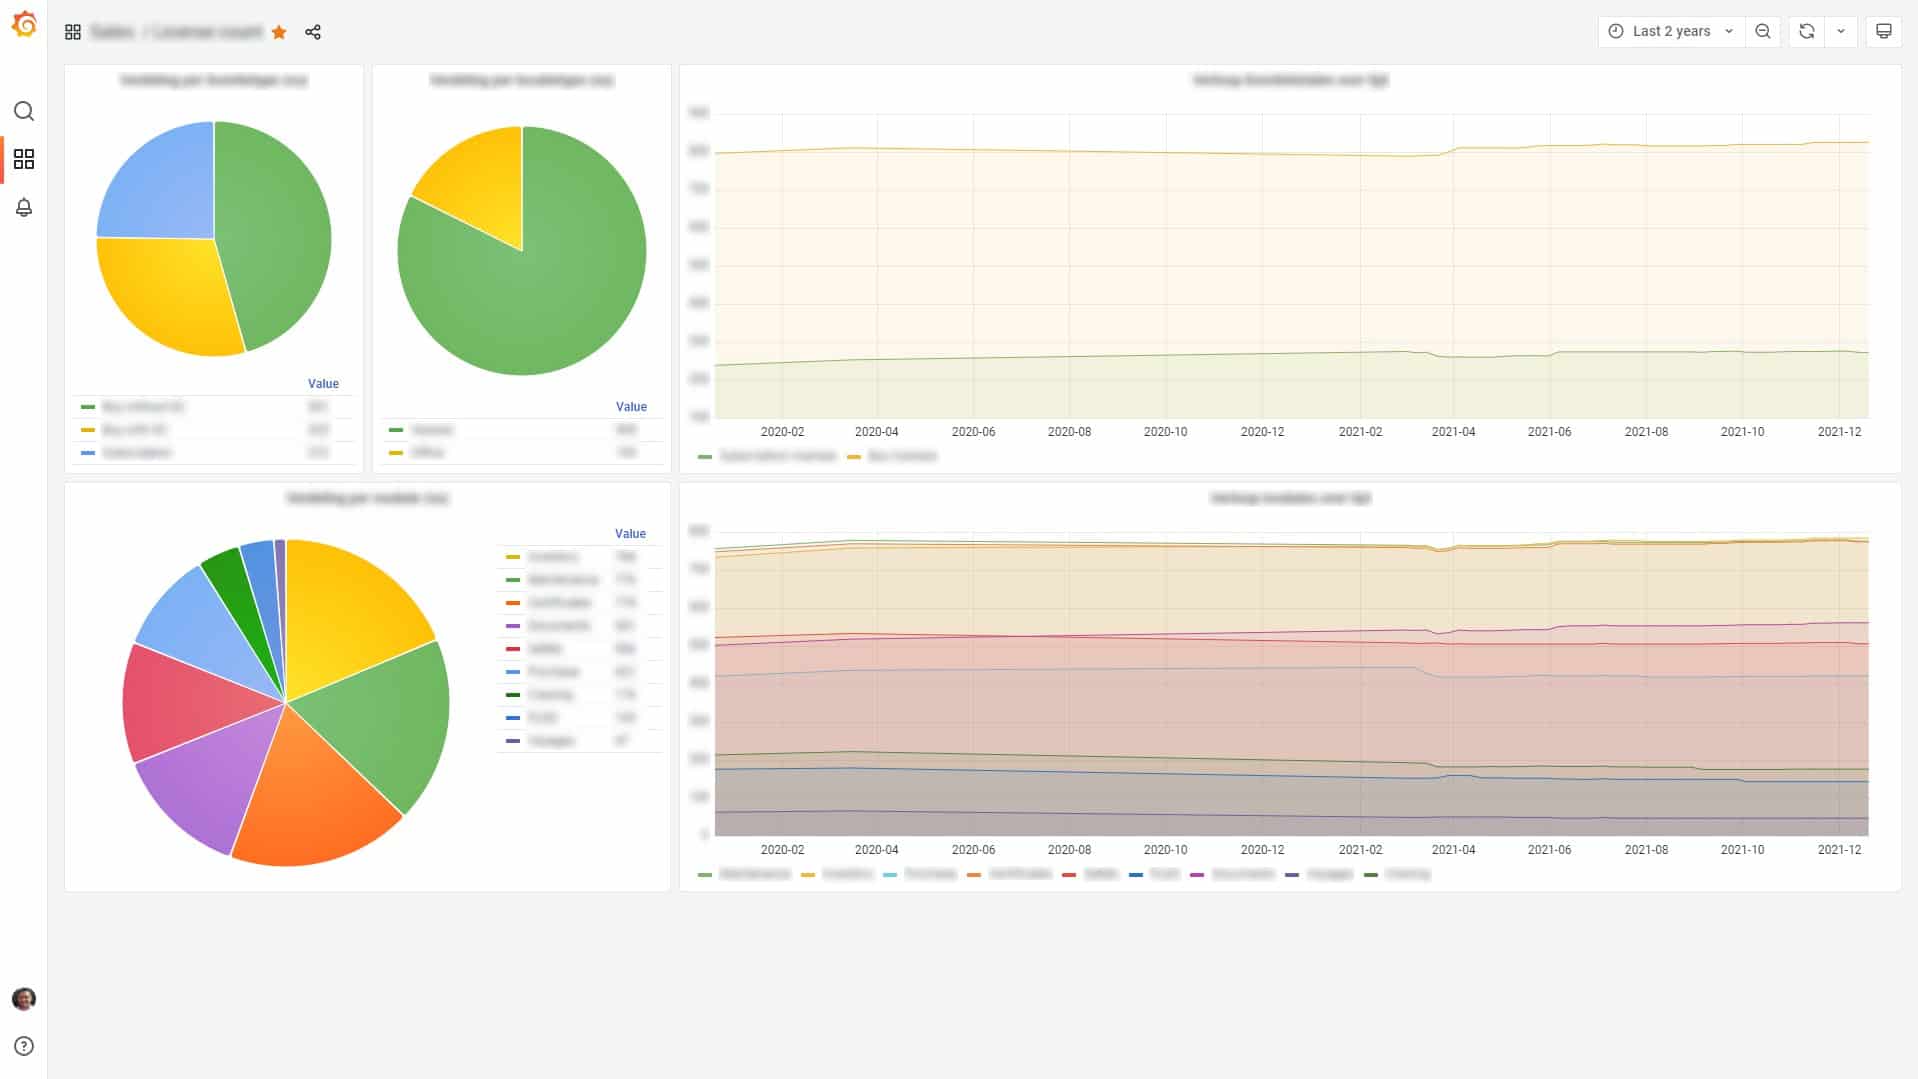
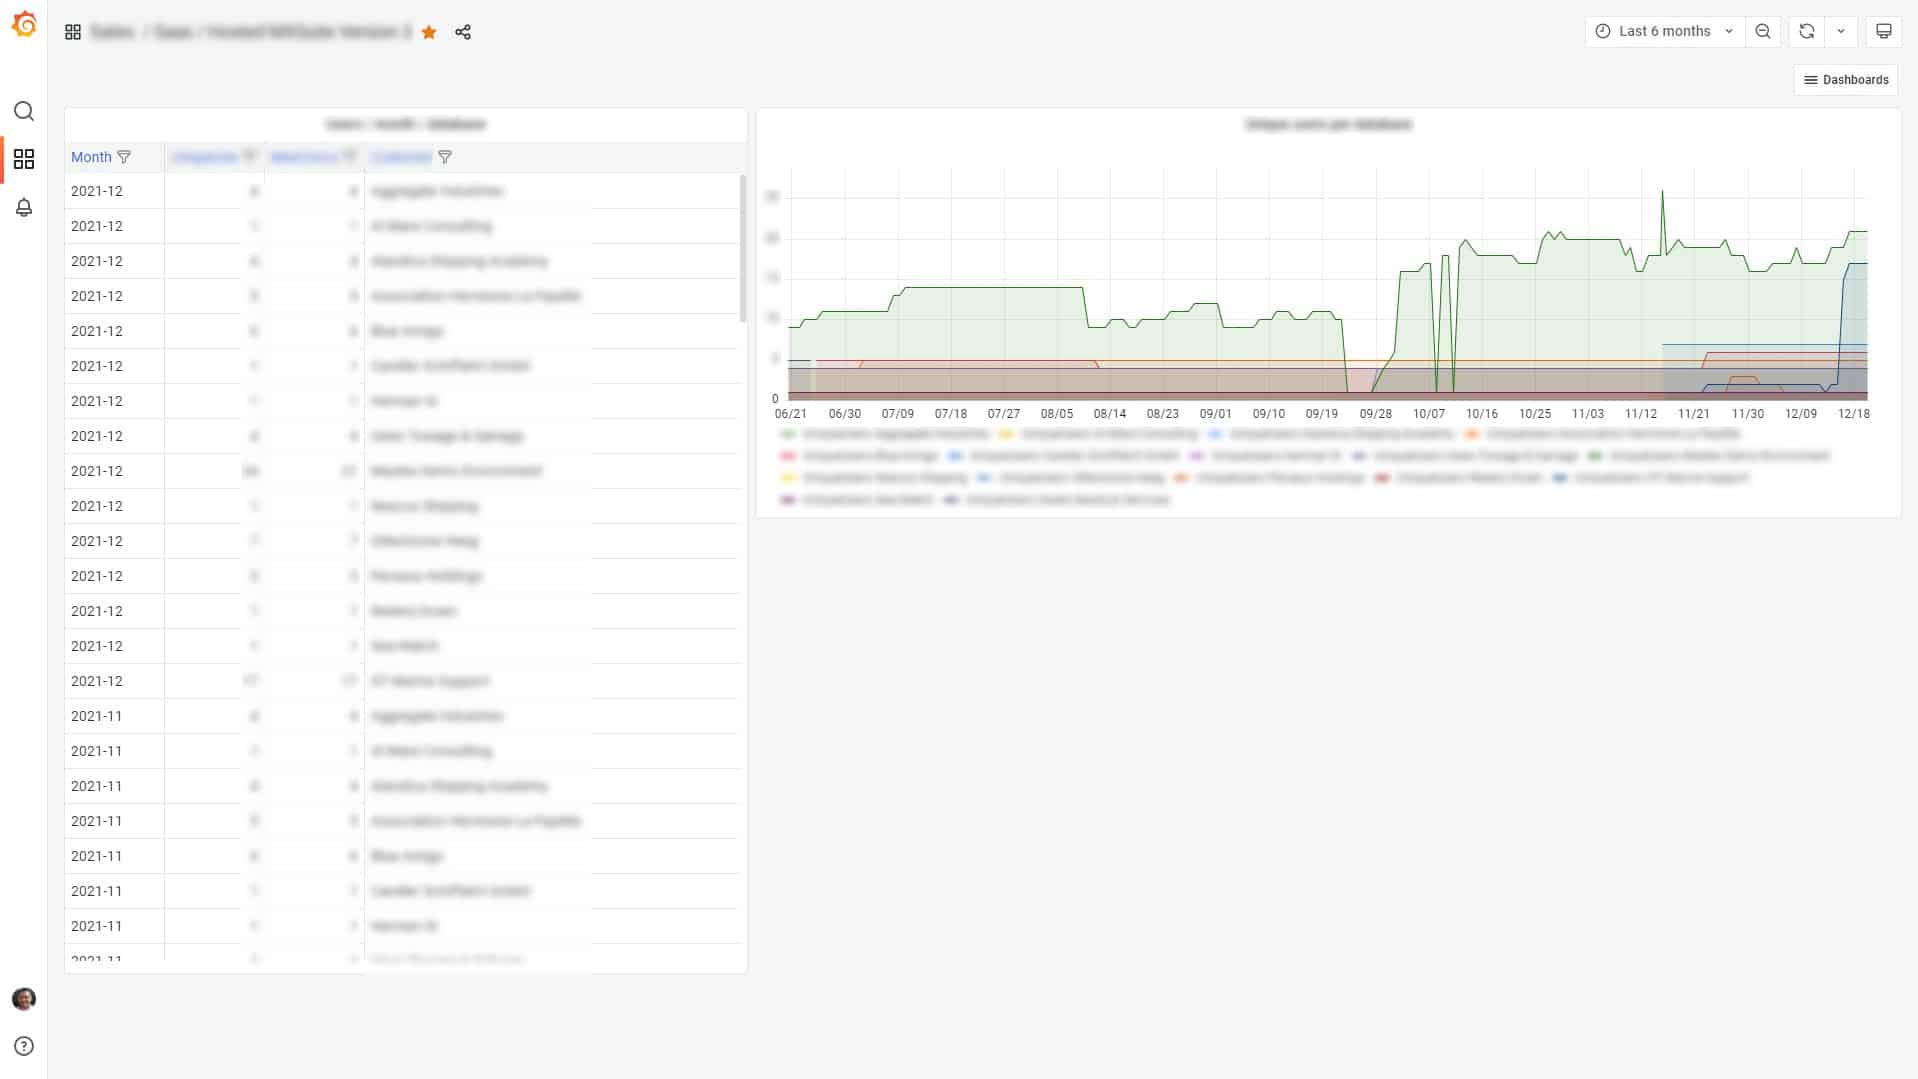
The dashboard allows you to visualize any data of the MXSuite database in the way and timeframe you want to have it. Visualizations can be displayed as graphs, gauges, bars, tables or pie charts. You can set the date and time ranges of your selected data entirely to your needs. An overview is generated in a matter of seconds.
The dashboard is also able to combine the data of the MXSuite database together with data from other software tools.
the dashboard module covers:
A fleet-wide overview of all aspects of ship management
Messenger function to individual MXSuite users
Reporting of all data available in MXsuite
Multiple office installation possible
Management of all users and user rights for office and vessels
Configuration of all modules with fleet-wide consistency
At Mastex software we like to keep things simple. You only select the modules you need. To further optimize your fleet management you might choose to add or combine other modules to make powerful combinations. Whatever your challenge is, we’ve got you covered.
The best way to experience the possibilities of MXSuite is to see it for yourself. Let us walk you through it via an online meeting or request a login in your email.
Thank you for being interested in extending your MXSuite package with this module. Fill in your details below and we will get back to you as soon as possible.